

The Big Picture
June brought good news for the Austin housing market, with prices, sales, and dollar volume all moving in a positive direction year over year. There's one trend worth watching, though: inventory is building fast, which is starting to shift some leverage back toward buyers even as prices firm up.

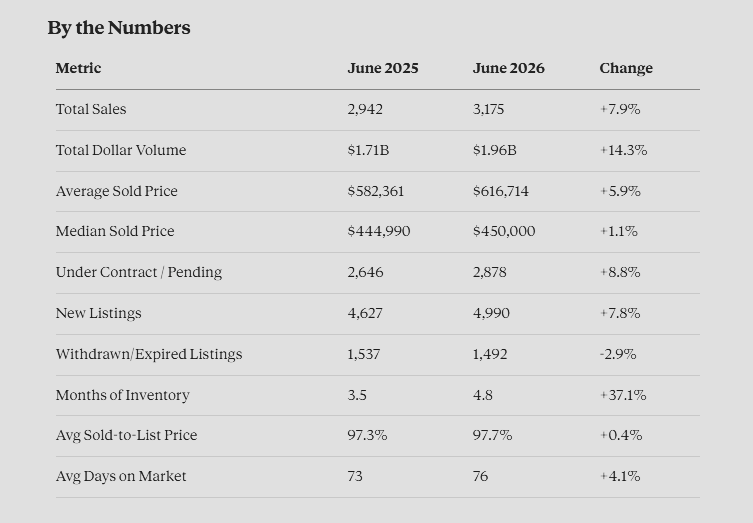
By the Numbers
Year to date, total dollar volume across the metro is up 6.06%, reaching $9.12 billion.
Prices Are Trending Up
After a period of flat to softening prices, Austin has turned a corner. The average sold price climbed to $616,714, its highest point over the trailing twelve months, while the median held a more modest gain to $450,000. Worth noting: price-per-square-foot only inched up on the average side and slipped slightly on the median side, which suggests some of the average price increase is being driven by a mix shift toward larger or higher-end homes selling — not pure across-the-board appreciation. Still, the overall direction is a welcome change after a rough stretch.
Sales Activity Is Accelerating
3,175 homes sold in June, up nearly 8% from a year ago, and total dollar volume jumped over 14% to just under $2 billion for the month. More transactions closing at higher prices is a strong signal — it points to genuine demand, not just a pricing story.
Pending Sales Signal a Strong Summer
Pending contracts are up 8.8% year over year to 2,878 units, and 2026 has outpaced both 2024 and 2025 through the entire first half of the year. Since pending sales typically convert to closings within 30–60 days, this points to a solid July and August ahead.
The Wrinkle: Inventory Is Building
Months of inventory jumped 37% year over year — from 3.5 to 4.8 — pushing Austin further into balanced-market territory. New listings are up nearly 8% while withdrawn/expired listings fell almost 3%, meaning sellers are both listing more and giving up less often. More supply paired with firmer pricing is an unusual combination, but it does mean buyers have more negotiating room than the headline numbers alone suggest.
What This Means for Buyers
You have more breathing room than you did a year ago — more homes to choose from and less pressure to make a rushed decision. That said, prices are firming up, so betting on a pullback while you wait could backfire. With average days on market at 76 and homes selling at 97.7% of list price, well-priced homes are still moving quickly. If you find the right property, today's mix of more choice and steady (not runaway) pricing works in your favor.
What This Means for Sellers
Demand and pricing are both in your favor, but the jump in inventory means more competition than last year. Pricing and presentation matter more now than they did twelve months ago. Homes priced right for the current market are still closing near list price — but overpricing in a market with growing supply is a fast way to sit unsold. Price accurately from day one and invest in how your home shows, and you're well positioned to capture these stronger prices.
Real estate is hyperlocal and hypersituational — these are metro-wide trends, and your specific neighborhood or price point may look different. Reach out if you'd like to talk through your situation.