

Austin Metro Market Update — July 2026
The Big Picture
Sales, dollar volume, and prices all moved up year over year in July, keeping 2026 on track to finish as a stronger year than 2025. Two numbers are worth a closer look, though: pending contracts came in essentially flat versus last July, and months of inventory climbed to 4.7 in the five-county metro — a sign the market continues to shift in buyers' favor even as the topline numbers look strong.

By the Numbers
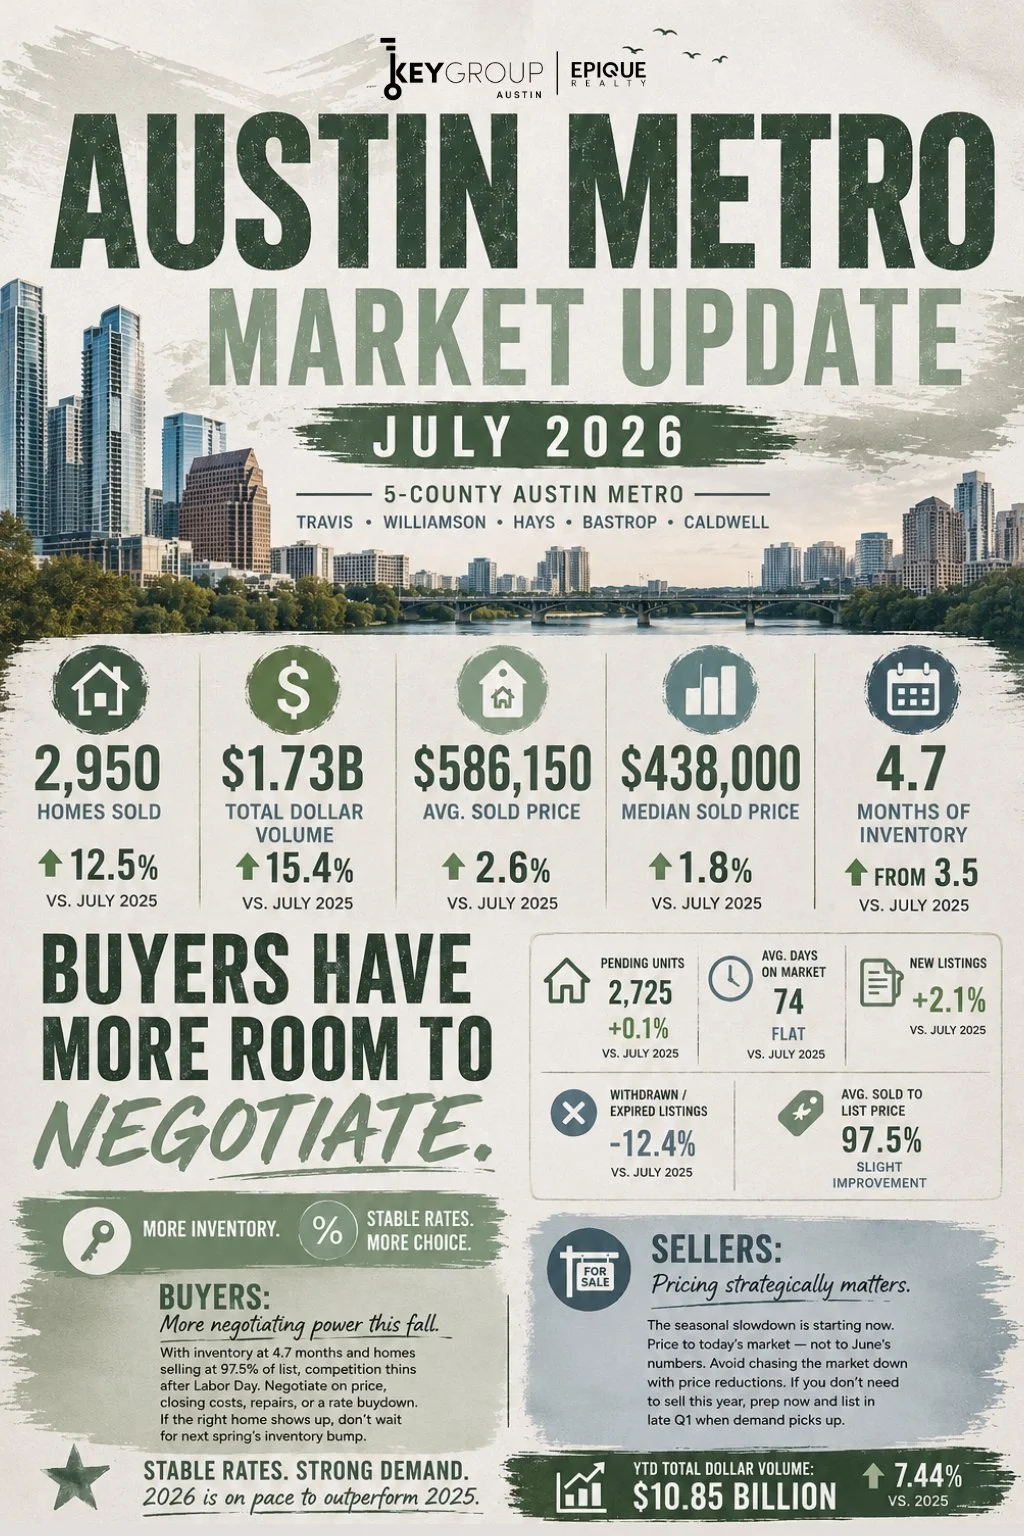
Year to date, total dollar volume is $10.85 billion, up 7.44% over 2025.
Prices Are Up — But You're Getting More House for the Money
Average and median sold prices both rose year over year, up 2.6% and 1.8% respectively. But the twelve-month trend line tells a more nuanced story: pricing has been close to flat overall, with a winter dip, a spring recovery, and a June peak that gave back some ground in July.
The more telling number is price per square foot, which actually fell on both an average and median basis. When total price rises while price per square foot drops, it means bigger homes are selling — not that homes are getting more expensive per square foot. Buyers are getting more square footage for their money than they were a year ago, a real gain that doesn't show up in the headline price figures.
Pending Contracts Are Flat — and That's a Better Sign Than It Looks
Pending units came in essentially unchanged from last July — about as flat as this data gets. Context matters here: July 2025 was already a strong month relative to the first half of that year, so matching it is a solid result, not a stall. Pending activity ran meaningfully ahead of 2025 from February through June before converging in July — which lines up with the seasonal slowdown that typically follows summer. Expect demand to ease gradually from here through year-end, in line with normal seasonality.
Inventory Keeps Building
New listings rose 2.1% while withdrawn/expired listings dropped 12.4% — more sellers are coming to market, and fewer are pulling out when they don't get their price. Together, those two trends explain the jump in months of inventory from 3.5 to 4.7. This isn't a market in distress, though: average days on market held steady at 74, and the average sold-to-list price ratio actually improved slightly to 97.5%. It's a market where buyers have real choice again, and sellers no longer fully set the terms.
Rates Held Steady, and the Market Kept Moving
The 30-year fixed averaged 6.69% in the first week of August, just slightly above last year's 6.63%. Rates aren't cheap, but they've been stable — and stability is what actually gets deals closed. Buyers and sellers who spent 2023–2024 waiting for rates to drop have largely stopped waiting, and July's dollar volume shows it: $1.73 billion, up 15.4% year over year. Barring a major shift this fall, 2026 is on pace to outperform 2025 by a solid margin.
What This Means for Buyers
This fall is your window. With inventory at 4.7 months and homes selling at 97.5% of list, competition thins out noticeably after Labor Day, and the sellers still active in September and October are the ones who genuinely need to sell. That gives you more room to negotiate — on price, closing costs, repairs, or a rate buydown — than you'd have in spring. If the right home shows up, don't wait for next spring's inventory bump; it'll bring more competing buyers with it.
What This Means for Sellers
The seasonal slowdown is starting now. If you need to sell in 2026, price to today's market — not to June's numbers — and be realistic about your competition. A series of small price reductions chasing the market down is the most common, and most costly, mistake sellers make in Q4. If you don't need to sell this year, the smarter move may be to prep now and list in late Q1 when demand typically picks back up.