

Austin Metro Market Update — August 2026
The Big Picture
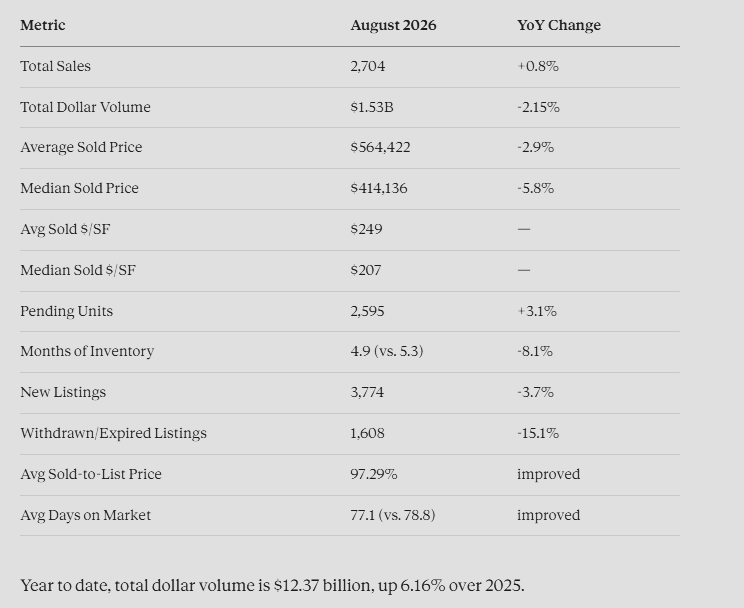
Activity held up in August — total sales and pending contracts both edged higher year over year, and inventory tightened as fewer sellers listed and far fewer walked away. Prices are the soft spot: average and median sold prices both declined year over year and continued to slide from their June peak, while mortgage rates climbed to a one-year high through the first half of September.

By the Numbers
Prices Have Pulled Back From the Summer Peak
August marked the second straight month of month-over-month price declines. Average sold price peaked around $615,000 in June and landed at $564,422 in August; median price slid from roughly $450,000 to $414,136 over the same stretch. The median decline (5.8%) outpaced the average decline (2.9%) year over year, which points to a shift toward lower-priced homes selling in August rather than a uniform pullback across every price point.
Some of this is normal seasonal rhythm — Austin prices typically peak in late spring and ease through the fall. What's worth flagging is that the trailing twelve-month median price trend is essentially flat, meaning there's been no real annual appreciation, and August landed below that line. Sellers who priced based on spring comps are finding that out the hard way right now.
Demand Held Up Better Than Expected
Pending units ran ahead of 2025 for the first five months of the year, converged with 2025 in June and July, and finished August slightly ahead at +3.1% year over year. Given that mortgage rates rose through the summer, holding even with last year is a solid outcome, not a disappointing one.
Dollar volume tells a similar story: August closed at $1.53 billion, down 2.15% year over year on lower prices, but year-to-date volume sits at $12.37 billion, up 6.16% over 2025. The strong spring built a cushion, and the second half of the year is now running roughly flat against last year.
Fewer New Listings, Fewer Sellers Giving Up
New listings came in at 3,774, down 3.7% year over year, tracking closely with 2025's pattern but landing slightly lower in August. The more telling number is withdrawn/expired listings, which dropped 15.1% to 1,608. Last year, many sellers pulled their homes in late summer to wait for a better market; this year, more of them are staying on, adjusting price, and getting deals done.
Fewer new listings, fewer withdrawals, and slightly higher sales together explain why months of inventory dropped to 4.9. That's still balanced-market territory, but the direction is toward tighter conditions — which matters for anyone expecting a wave of new inventory this fall. It isn't coming.
Mortgage Rates Reverse Course
The bad news is rates. The 30-year fixed climbed to 6.88% on September 10 — a new 52-week high — after a hotter producer price report and a firm inflation reading kept pressure on long-term borrowing costs. That's nearly a full point above the year's low of 5.90% in late February, and about 61 basis points above the same week last year. Buyers shopping at under 6% in spring are shopping at nearly 7% today, which explains most of the summer's price softness.
Headline inflation held at 3.4% year over year in August, with core CPI at 2.4%. Forecasters expect the 30-year rate to average in the mid-6% range through the rest of 2026 — the Mortgage Bankers Association projects 6.6–6.7%, Fannie Mae 6.7–6.8%. The practical takeaway: don't plan around rate relief this year. Plan around the payment you can afford today, and treat any future refinance as a bonus, not a strategy.
What This Means for Buyers
Prices are lower than they were in June, inventory is balanced, and sellers still active in September tend to be more realistic than the ones who listed back in April — that's a good buying environment even with rates near 7%. With the sold-to-list ratio at 97.29%, the typical negotiated discount is under 3%, so homes sitting 60+ days are where you'll find more room to negotiate. Get pre-approved, know your monthly number, and move when the right house shows up — waiting for rates to drop hasn't paid off for anyone in the last two years.
What This Means for Sellers
The market is rewarding sellers who price to last month's data and punishing those still anchored to spring comps. Average days on market sits at 77 — about two and a half months to go under contract — and the fall slowdown is beginning. If you need to sell in 2026, price to the current market now rather than chasing it down with reductions in November, when buyer traffic is roughly half what it is today. If you can wait, spring 2027 will likely bring more buyers, but nothing in the data suggests meaningfully higher prices — so waiting is a bet on demand, not on price.
The headline numbers are mixed: activity is steady, inventory is tightening, prices are softening, and rates are up. Where your specific home or neighborhood falls within those metro-wide averages can look very different. Real estate is hyperlocal and hypersituational — reach out if you'd like to talk through your situation.